Long Form Article: Are Markets Ready to Crash?
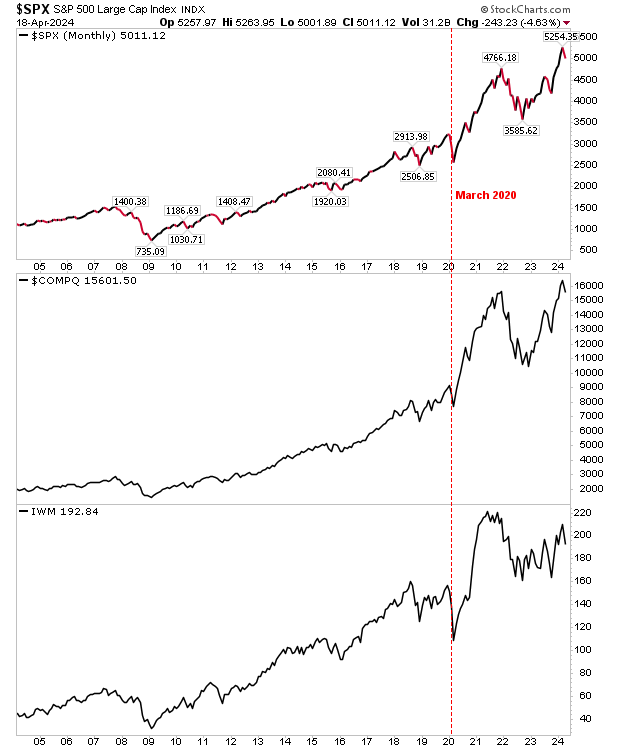
After any sustained period of gains in markets, talk often cycles towards market tops and potentially, the “C” word. From 2022 lows to its highs in March 2024, the S&P gained over 50% - a considerable gain for any index over a relatively short period. Given that, what can we look forward to in the months ahead?
The first thing I wanted to look at was the level of ‘chatter’ around the term “Market Crash” in search engine results. Searches like these are often counterintuitive, when everyone thinks markets are crashing, the worst is often behind it. For example, when we look at the Google search results for “Market Crash” over the last five years, there was a big spike for the search term in March 2020, but since then, very little.
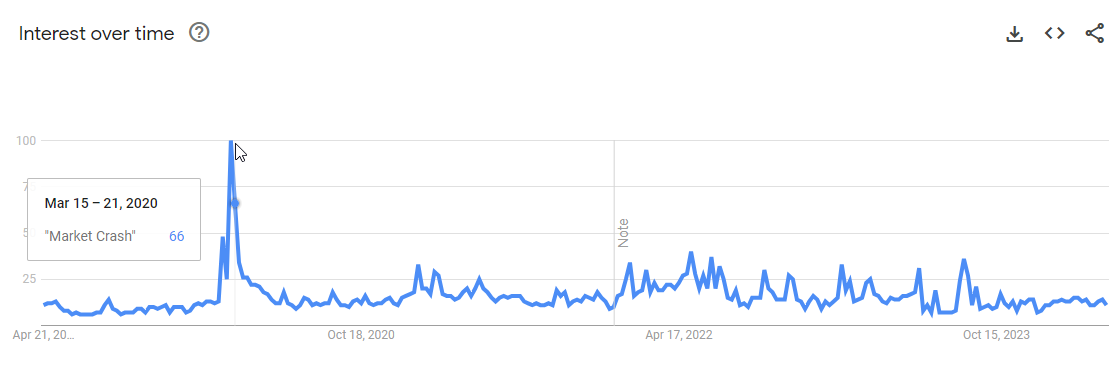
And what happened to the market when the spike occurred? No surprise to know it appeared in the month when markets marked a bottom. And we haven’t looked back since.
So, while there may be an inclination towards a market turn, we are not seeing this expressed in a concern in the broader investor community. Unfortunately, I would be much more confident for a period of positive returns had this search spike occurred, but we haven’t seen it yet. In this regard, I would score a point for the bears until we get this spike.
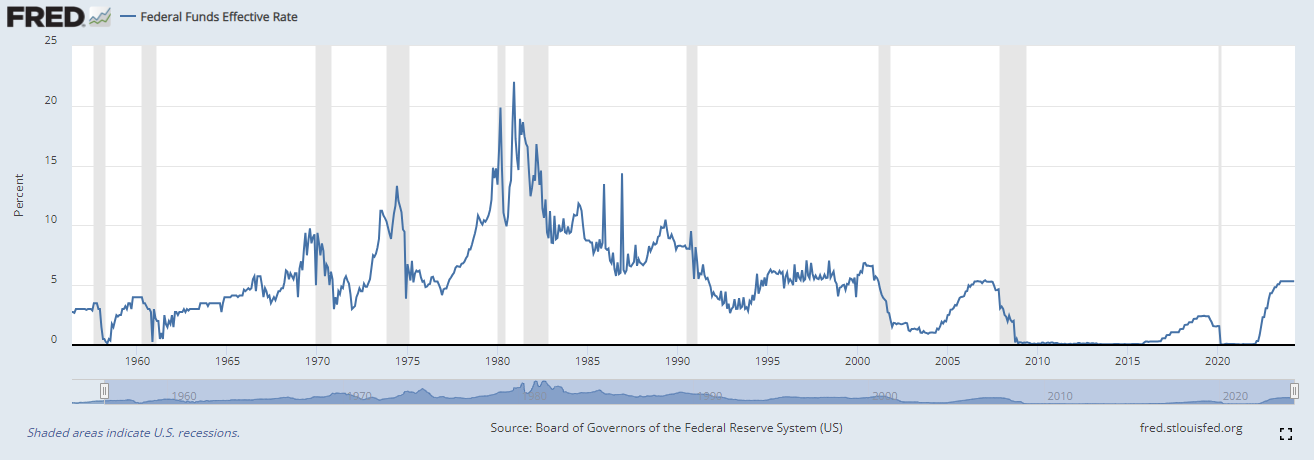
What about Interest Rates? When interest rates rise, share prices fall and money cycles into bonds. When rates rise, borrowing costs increase - reducing company investment that further pressures share prices. Rates have been rising, but where do we sit now?
Source: https://fred.stlouisfed.org/series/DFF
Well, the Fed has currently raised rates to a level comparable to the 2006-07 period. This is worrying as the 2008 financial crisis was initiated by increased subprime mortgage costs from rate hikes, exceeding holders ability to repay that led to the‘Great Recession’. The resulting collapse of the financial system ultimately led to one of the biggest market collapses not seen since the y2k crash of 2000-01. And while the memory of this period, “Those who cannot remember the past are condemned to repeat it.”, has not disappeared, the conditions which led to its outcome have not.
While subprime mortgages are no longer a factor, the large number of layoffs in the middle class over the past year has the potential to cause its own butterfly effect. These layoffs, many coming from the big Tech and gaming companies, have occurred in areas that are considered some of the most expensive places to live in the United States and this glut in developer supply can lead to long term unemployment or underemployment. The potential for another recession is high as these impacts filter down to jobs in the service sector and also lead to lower consumer spending. Score another point to the bears.
Next, we have the ever increasing creep of this year's U.S. presidential election. It has been a long time since the election of young Barack Obama, who offered a message of hope in the midst of the financial crisis. Markets soon followed with a generational low in March 2009, a level that is unlikely to be tested in anyone’s lifetime. This year, we have two of the oldest candidates running for office; one, where presidential successes take a back page to global geopolitical turmoil. The other, who will spend his entire campaign in court, and offers nothing to anyone but his immediate family and cronies. The election of the incumbent will at best be treated as status quo, the election of the latter will likely be a political and economic disaster. There is no fresh-faced knight to ride to the rescue as there was with Obama. As this year's election gets closer, it would not be unusual for markets to stay in “watch-and-wait” mode. Chalk this one to the bears.
Where things become a little more optimistic is when we dig a little more into price action and market sentiment. Covid brought considerable health and economic challenges. The new paradigm of the hybrid workplace is here to stay, but old economic rules remain. The extra hires taken on during this period are cycling out of the market as companies return to their pre-Covid staffing levels. However, we have already seen important market lows over the last four years, and these can’t be discounted in importance.
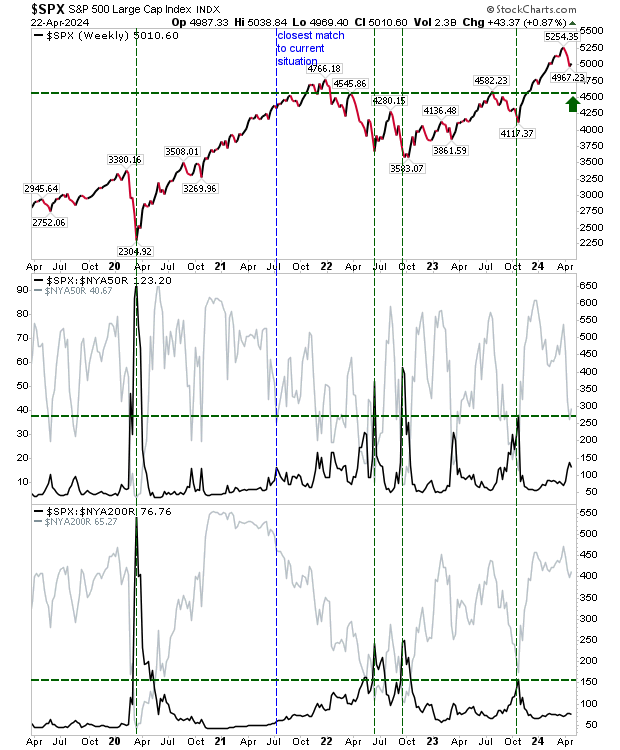
If we consider the percentage of stocks (in this case, data comes from the NYSE), that trade above their 200-day MA - effectively, the trailing average price of the stock for the year - and the 50-day MA, and look at the relationship of these two metrics to the S&P, we do see an interesting picture.
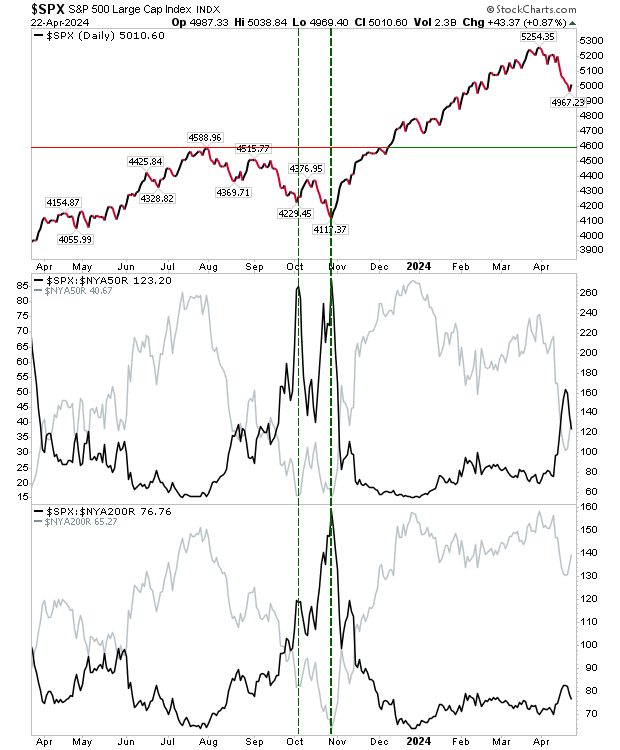
Currently, 65% of assets in the NYSE are trading above their 200-day MA (moving average), and 41% above their 50-day MA. We can see the relationship in the percentage of assets above their 50-day MA relative to the S&P price can give an early indication a market bottom is coming; this is the first spike we see in October 2023. The actual market bottom coincides with the spike in the relationship between assets trading above their 200-day MA relative to the S&P price; this occurred in November 2023. In the current scenario, we are only seeing the start of a potential spike in the percentage of assets above their 50-day MA relative to the S&P, and it may be late summer (or the election) before we see the full story play out with a spike in the 200-day MA relationship, which at the moment, isn’t too concerning.
In this same chart, I have also marked in an area of key price support of 4,588. Should markets continue to drift lower in the coming months, this price level will carry greater weight as an area where buyers may decide ‘now’ is a good time to return to the market. Should this price level be tested at a time when the aforementioned MA spikes occur, this would add further credence that a market bottom of significance is in place.
Even if we were to look at this on a longer time frame, e.g. over the last five years, we can see four clear spikes in this moving-average-to-index-price ratio: March 2020, June 2022, September 2022 and October 2023. As an investor, if you were to catch any of these spikes as a buying opportunity you would be very happy indeed, but it’s also clear, we are still someway from seeing a repeat in the market. The closest analogy we have is July 2021, when the percentage of stocks above their 200-day MA was quite high, but the percentage above their 50-day MA was quite low; this is marked as the blue-dashed line in the chart, but even here, the market had barely dipped, unlike the situation now. As a final point, this chart shows how significant the 4,550-4,600 zone could play out as support in the coming months.
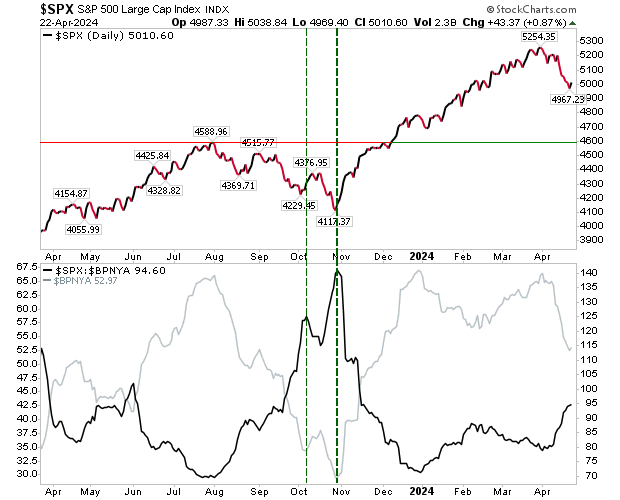
Another breadth metric that can give an indication as to where sentiment lies in the Bullish Percent Index. The advantage of this metric is that it looks at assets making breakouts as ‘buys’, that are independent of time; i.e. it’s a pure price signal tool. The Bullish Percents looks at the percentage of assets within an index that are on such ‘buy’ signals. It just gives another view of the big picture in the market. Currently, we have 53% of member assets on ‘buy’ signals; note, this doesn’t mean 47% are on ‘sell’ signals - there can also be ‘no’ signal. As with the relationship of this metric to S&P price, we don’t yet have a spike like we did in October 2023. Conclusion, no market bottom yet.
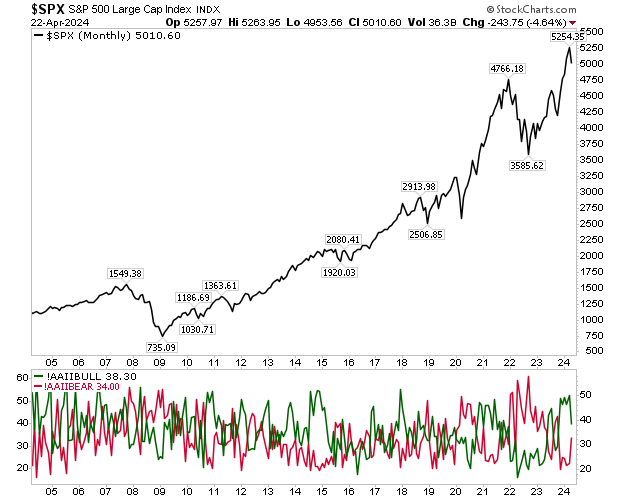
A harder relationship to ascertain is how the AAII Investor Sentiment Survey plays a role in determining market tops and bottoms. The chart below doesn’t give us any clear indication as to sentiment at reversal, particularly pre-2011 when the sentiment chart is a bit of a mess. If there are points of interest in this chart, investor sentiment in 2022 was more bearish than it was in 2008, and again, bearish extremes typically mark major lows. Current sentiment is bullish, but past bullish spikes haven’t necessarily corresponded to major tops, although one could conclude that until bearish sentiment starts to rise, we don’t have a major bottom either.
So what can we conclude? There is a complacency in the market; a Fed-induced recession coinciding with the election - and spikes in breadth metric ratios - would be a trifecta for further selling. The key positive, though, is the next low should mark a significant bottom and be an excellent investor opportunity. It’s not really a question of if, but when will this happen. And before we say goodbye to 2024 is probably a reasonable assumption on this.

